If you’re trying to understand how people use your website or app, Google Analytics 4 (GA4) is one of the best (and free) tools you can use. It’s built by Google and helps you track what visitors are doing—from where they came from to what they clicked on and if they completed important actions like signing up or making a purchase.
Unlike the old version of Google Analytics, GA4 focuses on events (specific user actions) rather than sessions. This means you get more flexibility and detail in understanding user behavior.
Why Custom Reports Matter in GA4
GA4 comes with some standard reports, but if you really want to answer specific questions—like “Which marketing campaign drove the most signups?” or “What content keeps people engaged?”—you’ll want to create custom reports.
You can build these using two main areas in GA4:
- Reports: For customizing standard reports
- Explore: For deeper, flexible analysis (this is where you’ll spend most of your time if you’re serious about insights)
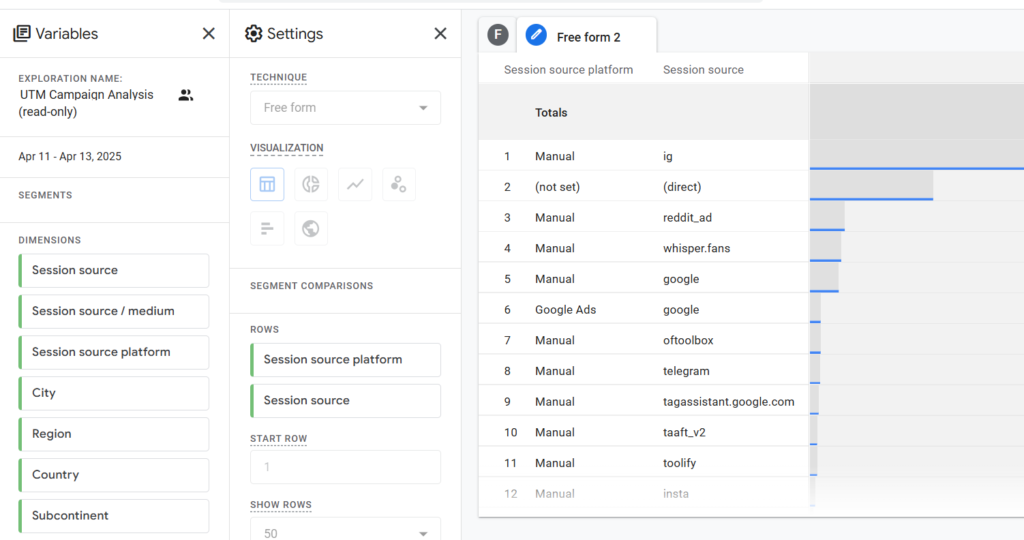
Building a Custom Report in GA4 (Step-by-Step)
- Go to the “Explore” section on the left-hand menu.
- Choose a template (like Funnel, Free Form, Pathing) or start from scratch.
- Drag and drop the dimensions (categories like “Page title” or “Event name”) and metrics (numbers like “Users” or “Conversions”) you want to analyze.
- Use filters and segments to narrow your view to specific groups—like mobile users or visitors from a particular campaign.
💡 Tip: Dimensions describe the “what” (e.g. what page, what device), while metrics tell you “how many.”
Use Prebuilt Templates If You’re New
GA4 includes several templates that cover common reporting needs like user journeys or conversion funnels. These are a great place to start. Just swap in your own dimensions and metrics based on your goals.
Segment Your Data for Better Insights
Want to understand how different audiences behave? Create segments, such as new vs. returning users, traffic from ads vs. email, or different age groups. This helps you spot trends and tailor your strategy accordingly.
Use Filters to Clean Up Your Data
Not all traffic is useful—especially your team visiting the site while testing. GA4 lets you create data filters (in Admin > Data Settings) to exclude certain IP addresses or internal traffic, so your reports stay clean and focused on real users.
Event Tracking: What It Is and Why It Matters
In GA4, everything is tracked as an event—page views, clicks, video plays, form submissions, and more. These events can be automatically tracked or manually set up via GA4 or Google Tag Manager.
Want to track a lead form submission? You can mark it as a conversion in GA4, and it’ll show up in your reports so you can see how many users are completing your key actions.
Measuring Conversions in GA4
To track conversions:
- Go to Admin > Events.
- Click Create Event if you need to define a custom one.
- Toggle the event on as a conversion.
This lets you monitor actions like “Book a demo” or “Sign up” and see which traffic sources drive those behaviors.
For advanced conversion tracking, we recommend implementing Google Tag Manager.
Understand How People Are Using Your Site
Use the Engagement reports in GA4 to see:
- Which pages people land on
- How long they stay
- How many pages they view per session
- Which content keeps them engaged
This helps you pinpoint what’s working and what might need improvement.
Final Thoughts
GA4 can feel overwhelming at first, but once you get the hang of events, reports, and segments, it becomes an incredibly powerful tool. Start small, track your top goals, use templates, and explore the data that matters to your business. The more you use it, the more valuable insights you’ll uncover.